Uptime monitoring, as an API.
Supaboard Uptime is a headless monitoring engine you build into your own product. It checks your endpoints on the schedule you set, opens an incident after consecutive failures, and sends one notification per state change — over webhook, email, Slack or Telegram. Everything happens through a REST API; there is no dashboard.
curl -X POST https://uptime.supaboard.app/v1/monitors \
  -H "X-RapidAPI-Key: YOUR_KEY" \
  -H "Content-Type: application/json" \
  -d '{"url": "https://api.myapp.com/health", "interval_seconds": 60}'
The engine, without the product
HTTP(S) checks
Intervals from 1 minute to 1 hour, with TTFB latency, custom request headers (stored encrypted) and 7 outcome classes — timeout, DNS, TLS and more.
Incidents, not noise
An incident opens after N consecutive failures (you choose N) and resolves on the first success. Each state change triggers exactly one notification; outages shorter than 60 seconds are merged into a single "brief outage" message.
SSL expiry alerts
Every HTTPS monitor tracks its certificate and notifies you 30, 14 and 7 days before expiry. Monitor responses include ssl_expires_at and ssl_days_remaining. Included on all plans.
4 alert channels
HMAC-signed webhooks, email, Slack incoming webhooks and Telegram. Each channel has a synchronous test call, so you can confirm delivery before you depend on it.
Safe by design
SSRF-guarded checker with DNS pinning; private and link-local targets are rejected. Your monitor headers are AES-256-GCM encrypted at rest.
Built for integration
OpenAPI 3.1 spec, ready-made Postman collection, one predictable error shape ({ error: { code, message } }) and plan limits enforced server-side.
Three calls to production
Create a monitor
POST /v1/monitors with a URL and an interval. Checks begin on the schedule you chose — nothing else to configure.
Add a channel
POST /v1/channels with a webhook URL, email address, Slack hook or Telegram chat ID, then confirm it with a synchronous test call.
Ship
Query check history, uptime percentages and incidents over the API and render them in your own status page or admin panel, under your own brand.
Alerts, where your team already is
Every state change triggers exactly one notification. Slack and Telegram get a concise down/up message; email includes the monitor summary, last-7-days stats and a latency sparkline. Each channel has a synchronous test call — and there are HMAC-signed webhooks for your own integrations, too.
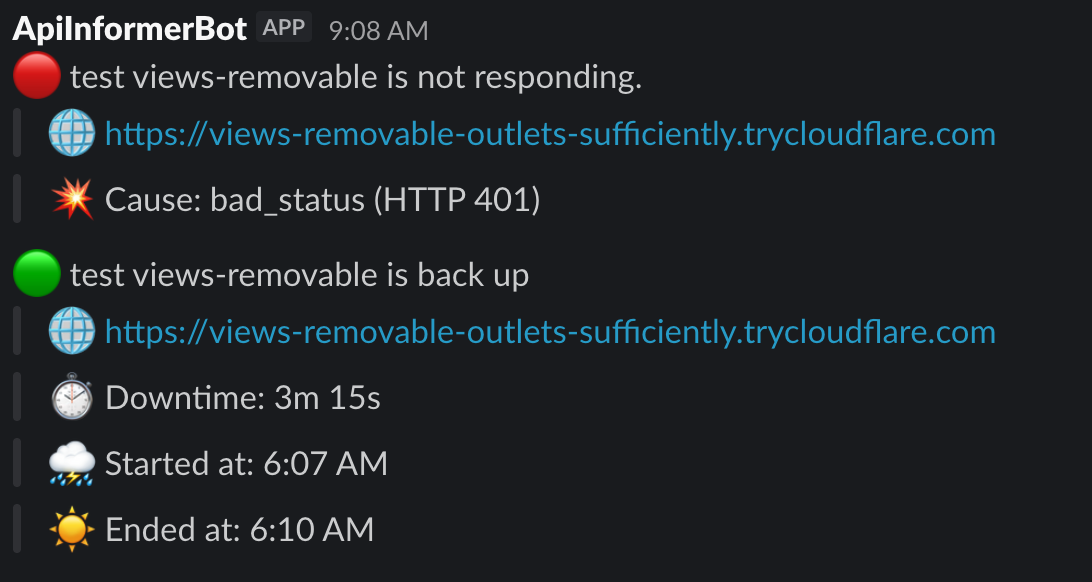
Slack
Down and back-up messages via your Slack incoming webhook — with the failure cause and total downtime.
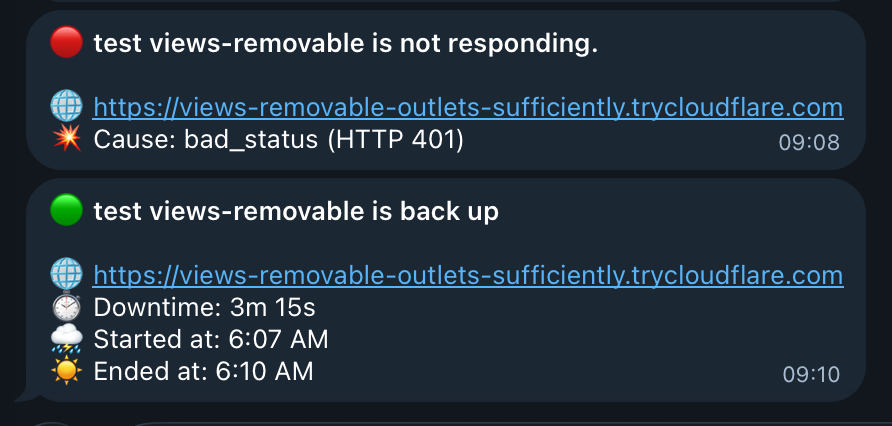
Telegram
The same concise down/up pair, delivered straight to any Telegram chat or group.
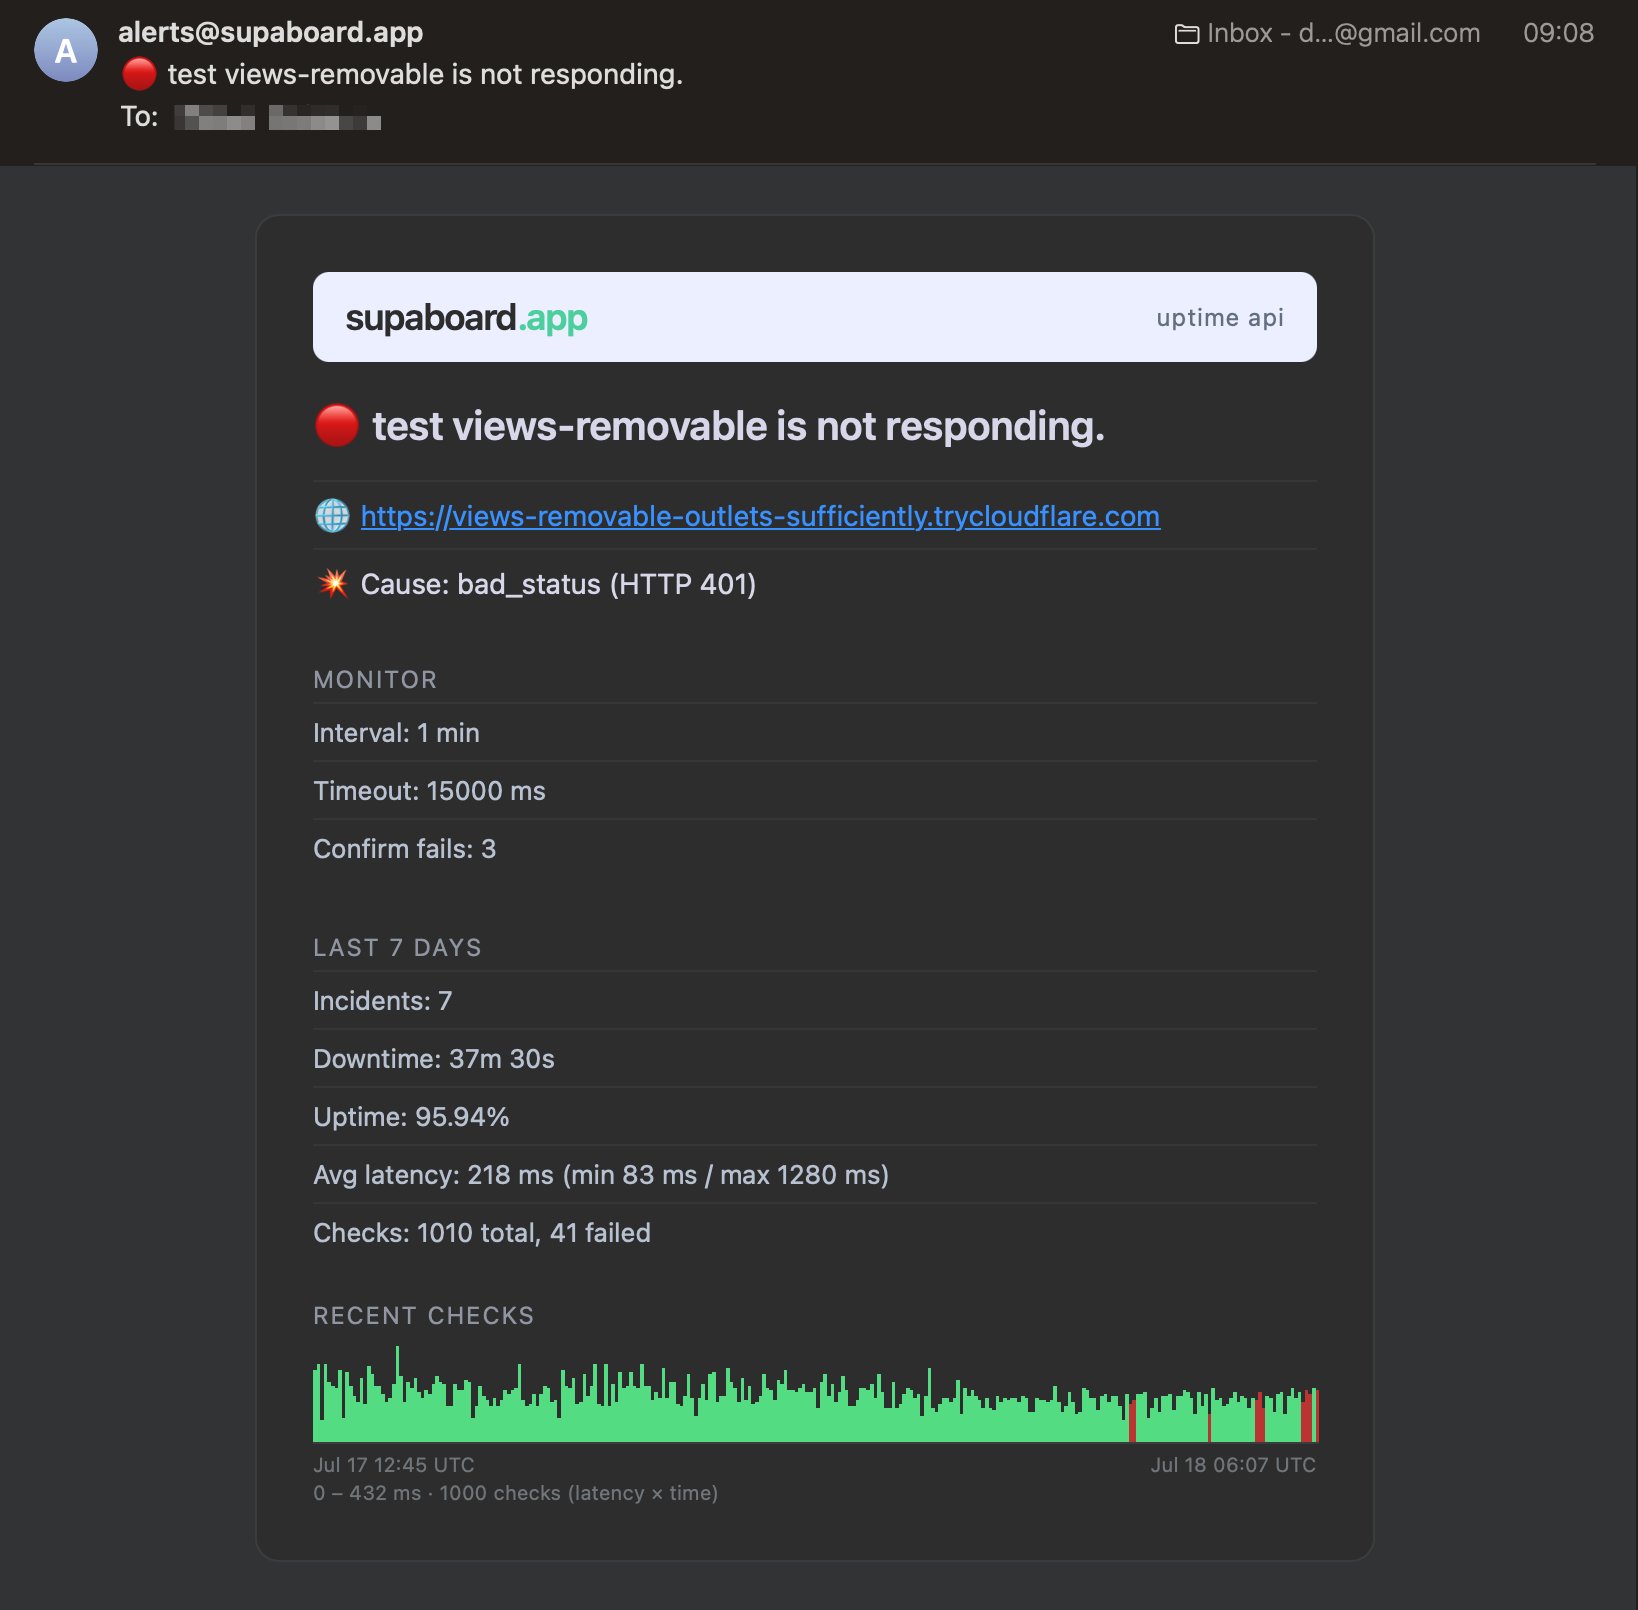
Email — outage
The "is not responding" email carries your monitor settings, last-7-days stats and a latency chart, so you can triage without opening anything else.
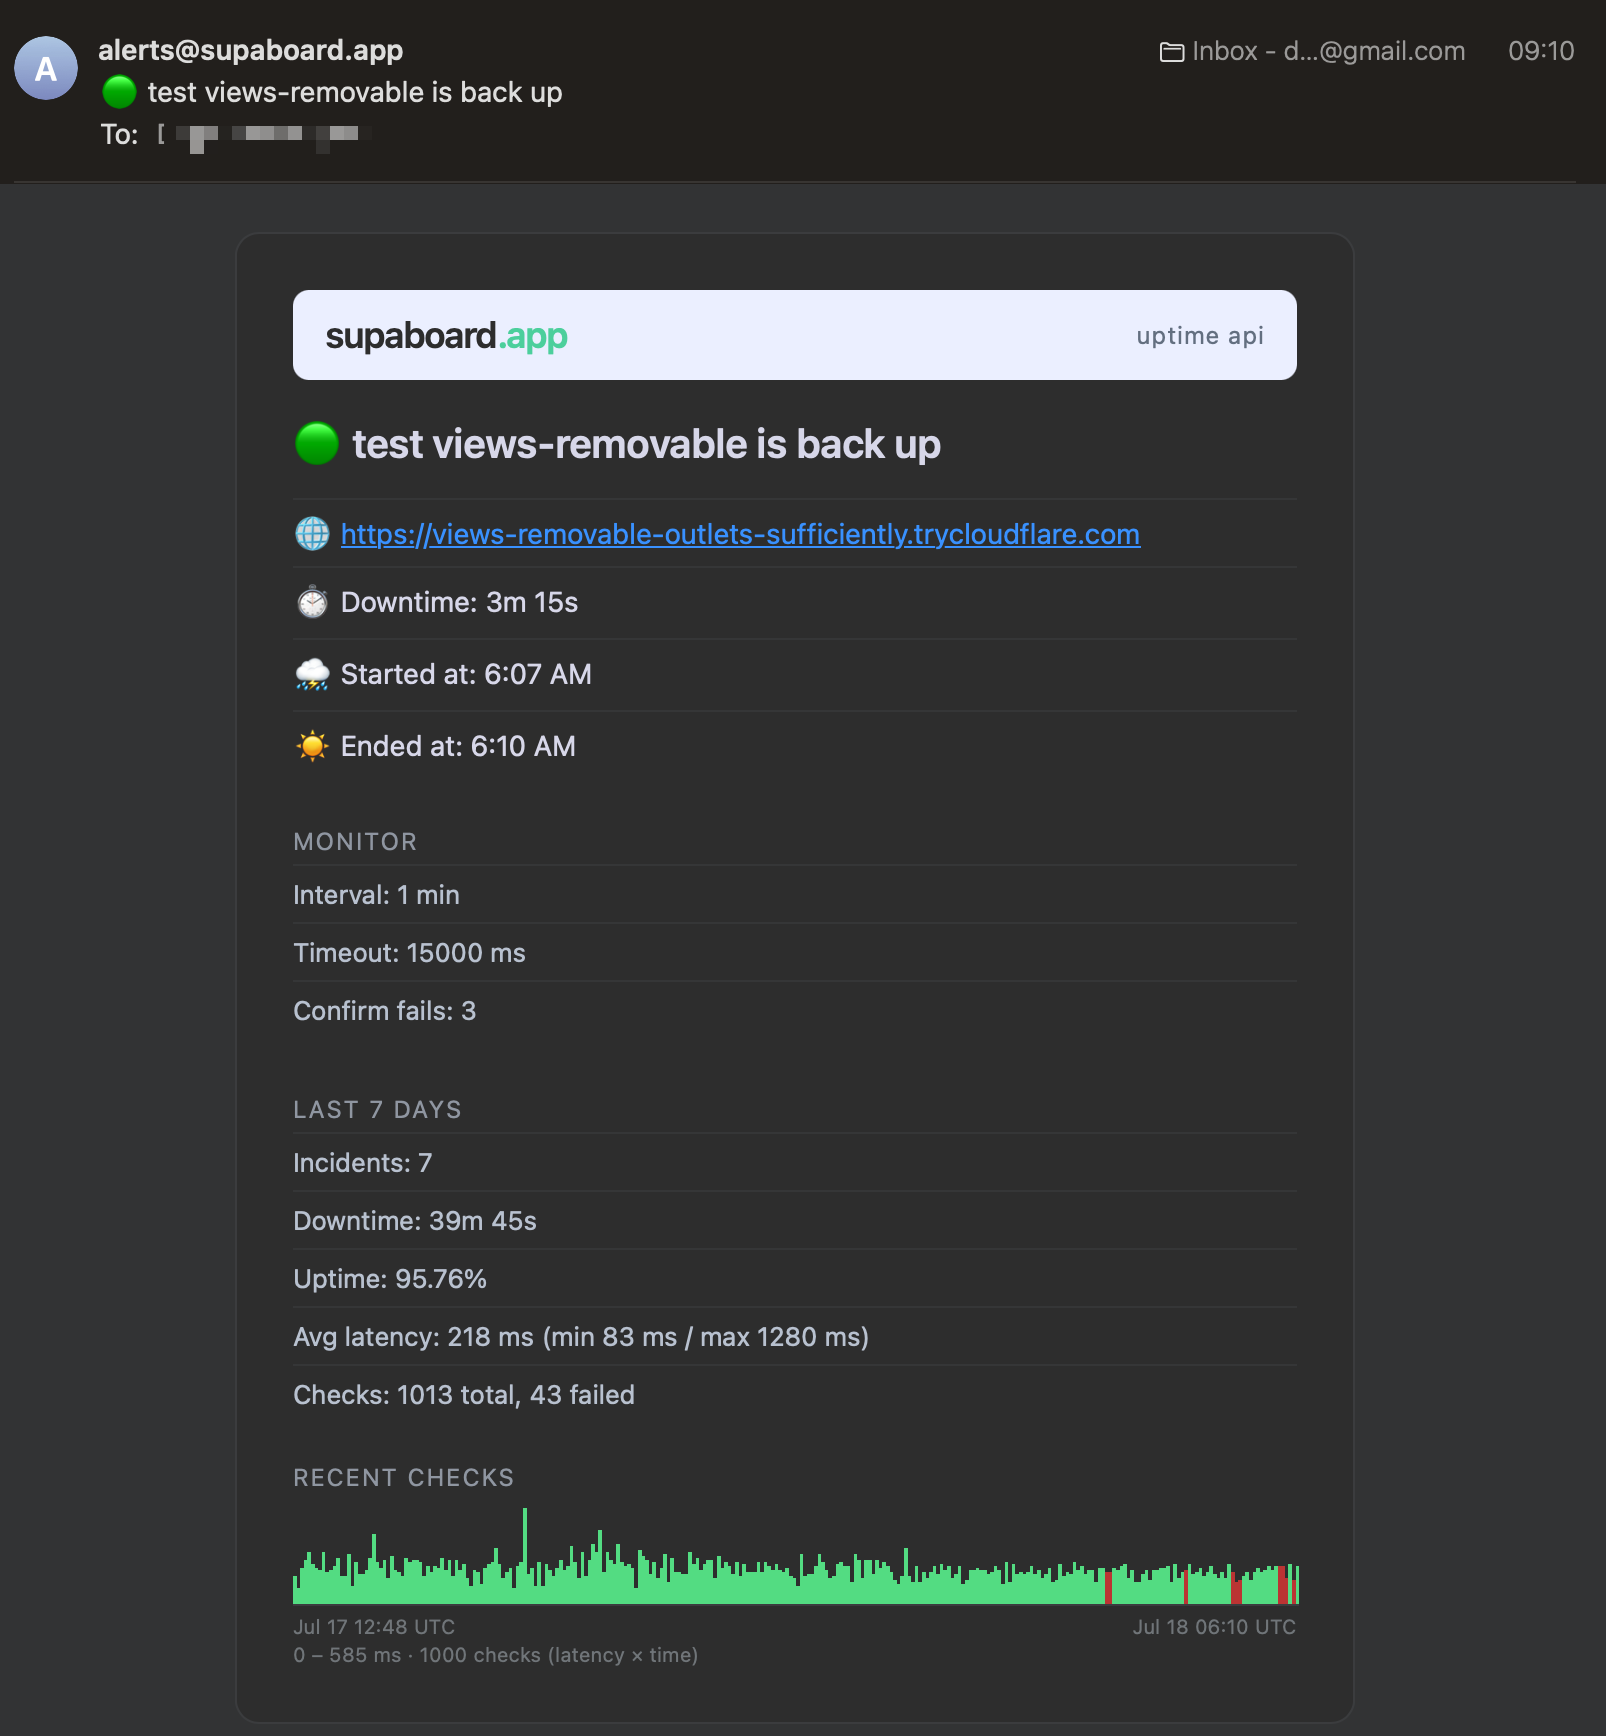
Email — recovery
The "is back up" email states how long the outage lasted, alongside the same stats and latency sparkline.
Simple plans, enforced server-side
Subscribe through RapidAPI — no separate account needed.
- 2 monitors
- 60-min interval
- Last 100 checks
- 1 channel (webhook/telegram)
- 10 monitors
- 5-min interval
- Last 1,000 checks
- 3 channels (+email, Slack)
- 50 monitors
- 1-min interval
- +90-day summaries
- 10 channels, all types
- 200 monitors
- 1-min interval
- +90-day summaries
- 25 channels, all types
FAQ
How quickly do I find out about an outage?
Checks run at the interval you configure — from 1 minute on ULTRA and MEGA up to 60 minutes on BASIC. An incident is confirmed after N consecutive failures (default 2, configurable per monitor), and the notification is dispatched as soon as the incident opens.
Can I build my own status page with it?
Yes — that is the point. History, stats and incidents are all API-accessible; render them however you like.
Does it watch SSL certificates?
Yes, on every plan. HTTPS monitors track certificate expiry and alert you 30, 14 and 7 days before it lapses; responses include ssl_expires_at and ssl_days_remaining. Keyword checks and multi-region verification are on the roadmap.